What this LTV:CAC calculator covers
Subscription businesses are judged on a handful of numbers: how much a customer is worth, what it costs to win one, how fast that cost comes back, how much recurring revenue there is, how many customers leave, and whether existing customers spend more over time. This page puts the six most-used calculations in one tool, each on its own tab:
- LTV:CAC calculator: customer lifetime value against customer acquisition cost.
- CAC payback: months of gross profit needed to earn back the cost of acquiring a customer.
- MRR and ARR: monthly and annual recurring revenue.
- Churn: the share of customers lost in a period.
- NRR: net revenue retention, recurring revenue kept from existing customers after upgrades, downgrades and cancellations.
- Rule of 40: growth rate plus profit margin.
The LTV:CAC calculator is the tab most founders open first, because the ratio sums up whether growth is worth paying for. The others explain why the ratio is what it is. Amounts work in rupees or any other currency; enter rates as percentages. In Indian notation, one lakh is 1,00,000 and one crore is 100 lakh.
How to use the SaaS metrics calculator
Pick the tab for the metric you need; the LTV:CAC calculator tab opens first. Each one needs only a few numbers from your billing and accounts.
- Choose a tab. Pick the LTV:CAC calculator, CAC payback, MRR/ARR, churn, NRR or the growth-plus-margin tab.
- Enter revenue inputs. For LTV and payback, enter average revenue per account per month, gross margin % and monthly churn %.
- Enter acquisition inputs. For CAC, enter total sales and marketing spend for a period and the new customers won in it.
- Enter retention inputs. For churn and NRR, enter the starting customers or MRR, then customers lost or the expansion, contraction and churned MRR.
- Read and compare. Results update as you type. Compare them month by month with the same definitions.
How LTV, CAC and the ratio are calculated
The calculator uses these formulas:
- LTV = ARPA × gross margin ÷ monthly churn. ARPA is average revenue per account per month. Dividing by churn gives the expected customer lifetime in months (3% monthly churn means 1 ÷ 0.03 = about 33 months), and the gross margin turns revenue into gross profit.
- CAC = sales and marketing spend ÷ new customers won in the same period.
- Ratio = LTV ÷ CAC.
Worked example
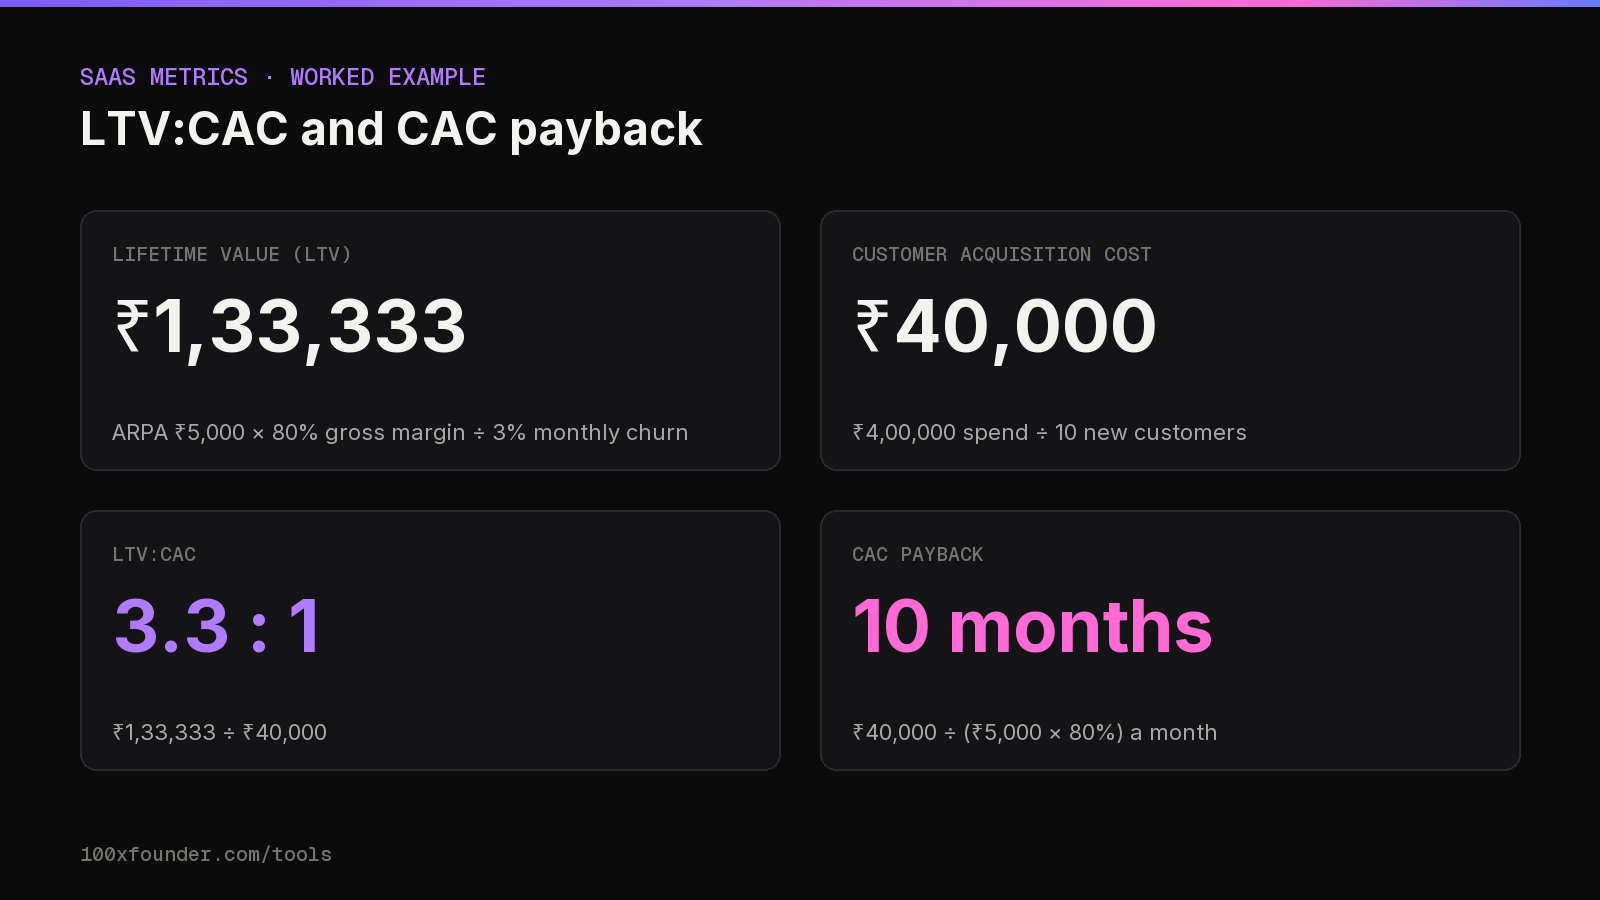
A B2B tool charges an average of ₹5,000 a month per account, runs at an 80% gross margin and loses 3% of customers a month. Last month it spent ₹4,00,000 on sales and marketing and won 10 new customers.
| Metric | Working | Result |
|---|---|---|
| LTV | ₹5,000 × 80% ÷ 3% | ₹1,33,333 |
| CAC | ₹4,00,000 ÷ 10 | ₹40,000 |
| Ratio | ₹1,33,333 ÷ ₹40,000 | 3.3 |
| CAC payback | ₹40,000 ÷ (₹5,000 × 80%) | 10 months |
David Skok's widely cited guide "SaaS Metrics 2.0" says the best SaaS businesses have an LTV to CAC ratio above 3, and that this is a guideline rather than a hard rule; many healthy companies don't meet it early on. By that yardstick the example in the LTV:CAC calculator clears the bar, just.
CAC calculation for SaaS: what to include
CAC is only useful if the spend is complete. Include salaries and commissions of the sales and marketing team, paid advertising, tools, agencies and events for the period, and divide by customers won in the same period. If your sales cycle is long, compare spend with customers won a cycle later. Andreessen Horowitz's "16 Startup Metrics" warns that blended CAC, which counts organic customers who cost nothing, can hide whether paid acquisition is working; look at paid CAC separately.
CAC payback period calculator
CAC payback (months) = CAC ÷ (ARPA × gross margin).
It answers a cash question: how many months of a customer's gross profit it takes to recover what you spent winning them. In the example, ₹40,000 ÷ ₹4,000 of monthly gross profit = 10 months. Until then, each new customer is a net cash cost, which is why fast-growing subscription companies can burn cash even when every customer is profitable over its lifetime.
Skok's guide says the best SaaS businesses recover CAC in about 5 to 7 months, and that profitability becomes weak once payback goes beyond 12 months. Payback also ignores churn: a customer who leaves in month 8 never pays back a 10-month CAC. If your churn is high, check the two numbers together.
MRR calculator and ARR calculation example
MRR = paying customers × ARPA. ARR = MRR × 12.
With 200 paying customers at an average of ₹5,000 a month, MRR is ₹10,00,000 (₹10 lakh) and ARR is ₹1,20,00,000 (₹1.2 crore). Stripe's guide to MRR describes the same customer method and notes that MRR counts only recurring subscription income: one-time fees, hardware and setup charges belong in total revenue, not MRR.
Annual plans paid upfront count towards MRR at one-twelfth of their annual value. Discounts should be netted off, and free trials don't count until they convert. ARR here is simply MRR × 12, a run rate, not a forecast of what you will bill over the next year.
Churn rate calculator
Churn rate = customers lost in the period ÷ customers at the start of the period.
If you start the month with 200 customers and 6 cancel, churn is 6 ÷ 200 = 3%. Count only customers who were there at the start; new customers who join and leave in the same month distort the rate. That 3% is the monthly churn the LTV tab uses.
Monthly churn compounds. At 3% a month, the share of a starting group still with you after a year is 0.97 to the power of 12, about 69%, so annual churn is roughly 31%, not 36%. Quote which one you mean.
Customer churn and revenue churn are different. a16z's metrics guide separates gross churn (revenue lost) from net churn, which subtracts upgrades and can make losses look smaller than they are. That is what the next tab measures.
NRR calculator (net revenue retention)
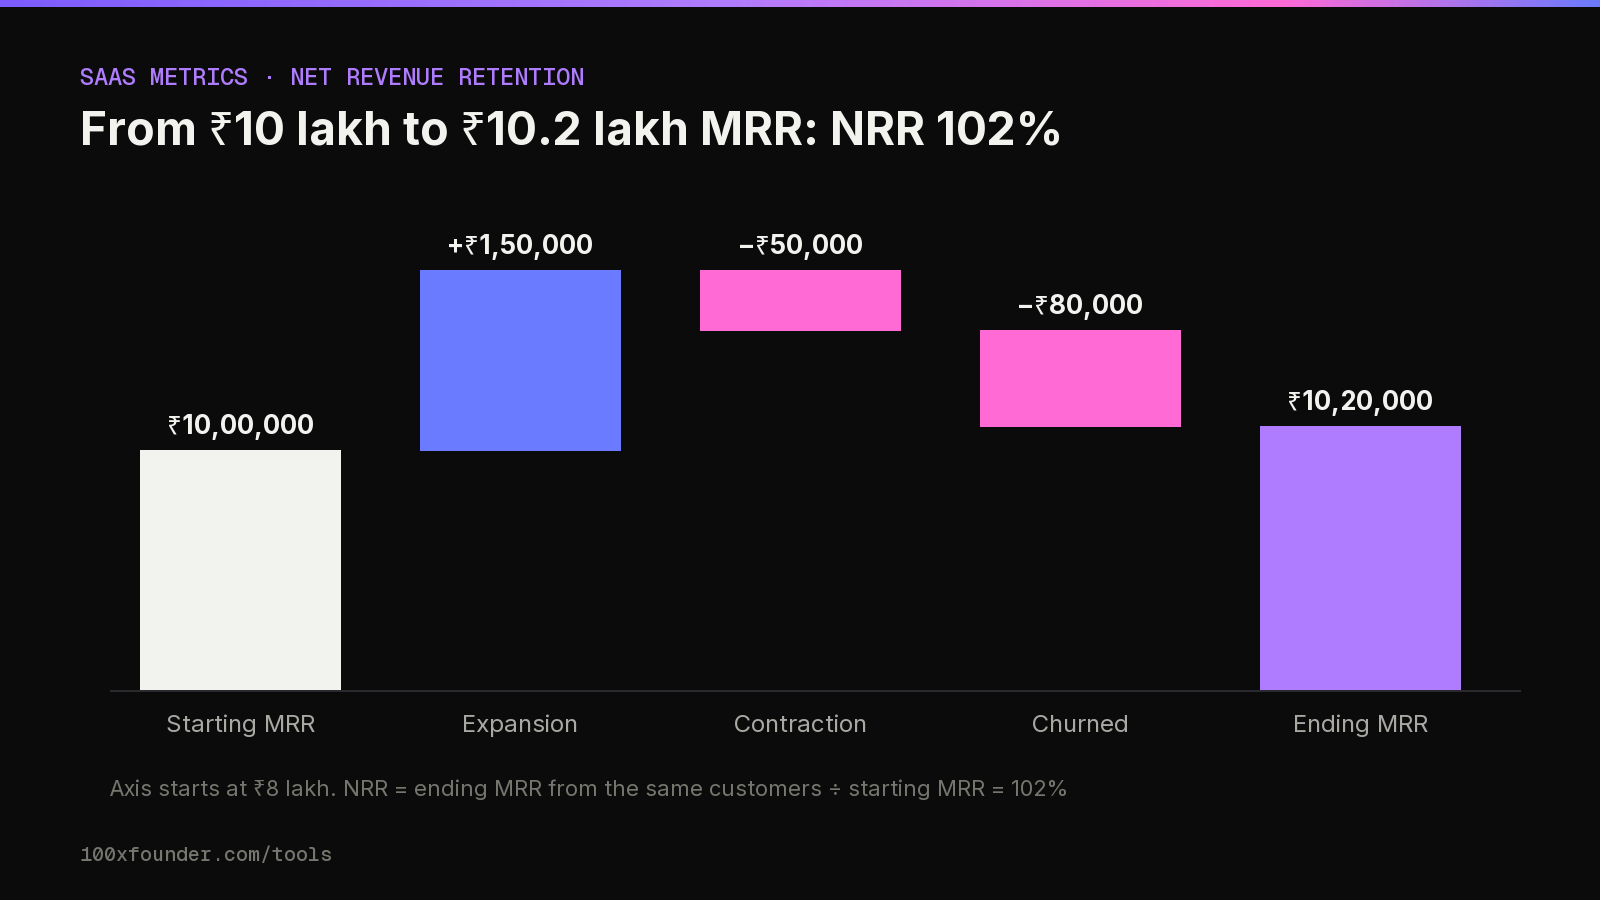
NRR = (starting MRR + expansion − contraction − churned MRR) ÷ starting MRR.
Take a cohort of customers paying ₹10 lakh of MRR at the start of the year. Over the year they add ₹1.5 lakh through upgrades and extra seats, lose ₹0.5 lakh through downgrades, and ₹0.8 lakh leaves with customers who cancel. NRR is (10 + 1.5 − 0.5 − 0.8) ÷ 10 = 102%.
Above 100% means existing customers alone grew revenue, even before any new sales. Skok calls this negative churn: expansion from existing customers outweighs what is lost to cancellations, so each cohort's revenue grows over time. Usage-based pricing and upsells are the usual routes to it. New customers won during the period are excluded from NRR by definition.
Rule of 40 calculation for SaaS
Rule of 40 score = revenue growth rate % + profit margin %.
A company growing 30% a year with a 15% profit margin scores 30 + 15 = 45, above 40. Brad Feld described the rule in 2015 as growth rate plus profit adding up to at least 40%: a company growing 20% should be making a 20% profit, while one growing 50% can afford to lose 10%. He suggested measuring growth as year-on-year growth in MRR and preferred EBITDA as the profit measure, checked against others such as free cash flow. Say which measures you used when you quote a score.
It is a rough balance check for companies past the early stage, not a target for a company at ₹10 lakh of MRR. Early on, growth is the number that matters most; Paul Graham's essay "Startup = Growth" argues it is what defines a startup in the first place.
Improving LTV:CAC: three levers
Every input in the LTV:CAC calculator is a lever, and some move the ratio more than others. Take a smaller product sold to small businesses: ₹1,500 a month per account, a 75% gross margin, 5% monthly churn, and ₹3,00,000 of sales and marketing spend that wins 40 customers. LTV is ₹22,500, CAC is ₹7,500, the ratio is 3.0 and payback is about 6.7 months. Now change one thing at a time:
| Change | LTV | Ratio | Payback |
|---|---|---|---|
| Starting point | ₹22,500 | 3.0 | 6.7 months |
| Churn cut from 5% to 3% a month | ₹37,500 | 5.0 | 6.7 months |
| Price raised to ₹1,800, churn unchanged | ₹27,000 | 3.6 | 5.6 months |
Cutting churn raised lifetime value by two-thirds but didn't shorten payback, because payback ignores how long a customer stays. Raising the price helped both, as long as it doesn't drive churn up; run the price change through the tool with a higher churn too, to see where it stops paying off.
Lever 1: retention
Because churn sits in the denominator of LTV, small improvements at high churn are worth a lot. Onboarding, support response and the first weeks of use are where most early cancellations are decided; look at who leaves and when before changing anything else.
Lever 2: price and packaging
ARPA lifts LTV and shortens payback at once. Annual plans, usage-based tiers and add-ons are common ways to raise it, and they can feed expansion revenue in NRR too.
Lever 3: acquisition efficiency
CAC falls when the same spend wins more customers: better conversion on the website and in trials, sales effort focused on the segments that close, and channels that bring customers without paid media. Re-run the LTV:CAC calculator by channel to see which ones earn their budget.
Where to find the inputs
Most of the numbers come from two places: your billing system and your accounts.
- ARPA and customer counts come from billing. Use paying accounts at the end of the month and their recurring charges, after discounts. If you bill some customers yearly, divide their annual fee by 12.
- Gross margin comes from the accounts: revenue minus the direct cost of delivering the service (hosting, third-party APIs, payment fees, customer support), divided by revenue. Agree the definition once and keep it.
- Churn comes from billing: accounts that cancelled or didn't renew during the month, against accounts at the start of the month.
- Sales and marketing spend comes from the accounts and payroll: salaries and commissions of the people who sell and market, ad spend, tools, events and agencies.
- Expansion and contraction come from billing: the change in recurring charges for customers who were already paying at the start of the period.
For a young company with a handful of customers, a single month's figures swing a lot. Use a three-month average for churn and CAC, and say so when you share the numbers. Investors care more about a consistent method and an honest trend than about a flattering single month.
Reading the numbers together
No single metric tells the story. A high ratio from an LTV:CAC calculator built on a churn guess you haven't measured is not real. A short payback with falling NRR may mean you are winning small customers who don't grow. Use the tabs together:
- If the ratio is low, check whether the problem is churn (LTV side) or spend per customer (CAC side).
- If payback is long, look at pricing and gross margin before cutting marketing.
- If NRR is under 100%, retention and expansion deserve attention before more acquisition spend.
Track the inputs monthly and keep the definitions fixed, so changes reflect the business, not the method. If you are preparing for a raise, see what comparable companies are announcing on our funding tracker, check how long your cash lasts with the runway calculator, and for AI products work your API bill into gross margin with the token cost calculator.
Tips and common mistakes
Tips
- Use gross margin, not revenue, in LTV and payback. a16z's "16 More Startup Metrics" says software businesses typically reach gross margins of about 80–90%; for AI products, model and hosting costs come out of gross margin and can pull it lower.
- Measure churn by cohort as well as overall, so new and old customers don't hide each other.
- Recalculate CAC by channel; a blended number hides the channel that loses money.
- Use a cautious churn figure for young companies; a few months of data can mislead in either direction.
Common mistakes
- Leaving salaries out of CAC. Ad spend alone understates it.
- Counting one-time fees in MRR.
- Mixing monthly and annual churn in the same LTV formula.
- Including new customers in NRR. It measures the existing base only.
- Treating 3:1 or 40 as laws. Use the LTV:CAC calculator to compare yourself with your own past months first. They are guidelines from investors and operators, useful for comparison, not pass marks.
FAQ
How do you calculate the LTV to CAC ratio?
Divide customer lifetime value by customer acquisition cost. LTV is average monthly revenue per account times gross margin divided by monthly churn; CAC is sales and marketing spend divided by new customers. This LTV:CAC calculator does both steps and shows the ratio.
What is a good ratio in an LTV:CAC calculator?
David Skok's "SaaS Metrics 2.0" says the best SaaS businesses are above 3, and calls it a guideline rather than a hard rule.
How is CAC calculated for SaaS?
Total sales and marketing cost for a period, including salaries, commissions, ads and tools, divided by the new customers won in that period.
What is a good CAC payback period?
Skok's guide says the best SaaS companies recover CAC in about 5 to 7 months, and that beyond 12 months profitability gets weak. Read it together with churn.
How do I calculate ARR from MRR?
Multiply MRR by 12. For example, ₹10 lakh of MRR is ₹1.2 crore of ARR. Leave one-time fees out of both.
What does NRR above 100% mean?
Existing customers grew revenue on their own: upgrades and expansion outweighed downgrades and cancellations. New customers are not included.
Should I use customer churn or revenue churn for LTV?
The formula here uses customer churn with average revenue per account, which is simplest. If large and small customers leave at very different rates, revenue churn gives a truer picture; track both and say which one you used.
How do you calculate the rule of 40?
Add the revenue growth rate and the profit margin, both as percentages. Growth of 30% and a 15% margin give 45. Brad Feld suggested EBITDA as the profit measure.
Sources
- For Entrepreneurs (David Skok), “SaaS Metrics 2.0: A Guide to Measuring and Improving What Matters”, 2016
- Andreessen Horowitz (a16z), “16 Startup Metrics”, 2015-08-21
- Feld Thoughts (Brad Feld), “The Rule of 40% For a Healthy SaaS Company”, 2015-02-03
- Stripe, “What is MRR, or monthly recurring revenue?”, 2026-05-11
- Andreessen Horowitz (a16z), “16 More Startup Metrics”, 2015-09-23
- Paul Graham, “Startup = Growth”, 2012-09
Estimate only, not tax or legal advice. Slabs, the ₹75,000 / ₹50,000 standard deduction, the Section 87A rebate (up to ₹12 lakh taxable income in the new regime, ₹5 lakh in the old) with marginal relief, surcharge with marginal relief and the 4% cess follow the Income-tax Act, 2025 for tax year 2026-27 (rates unchanged by the Finance Act, 2026); the PF cap uses the ₹25,000 wage ceiling in force from 17 September 2026. Your payslip may differ (allowances, perks, state professional tax rules). Confirm your tax with a qualified professional or on incometax.gov.in.